Static Code Analysis of Apex
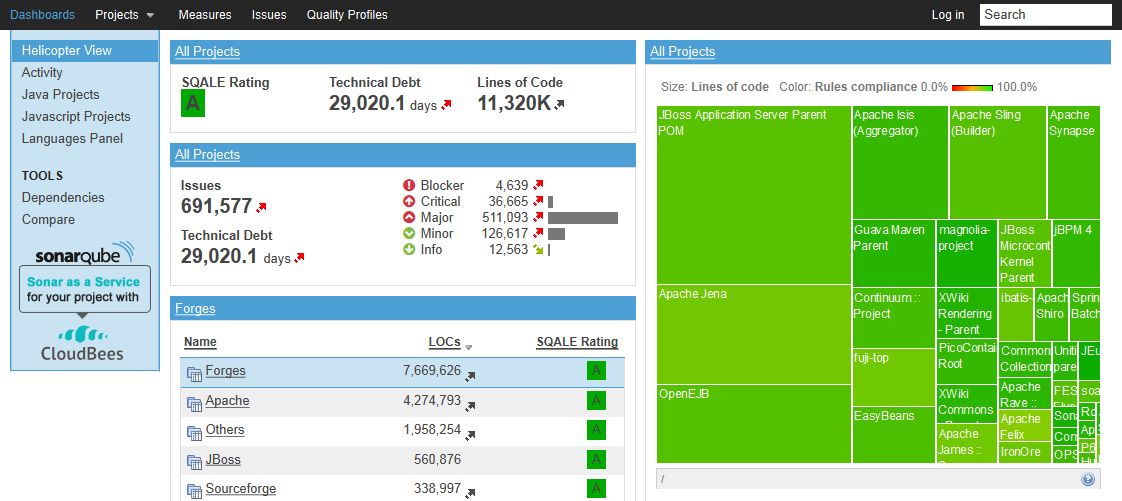
Would you wander down memory lane with me? It was on one of my first projects at Trifecta that I was introduced to Sonar (now SonarQube), a dashboard that aggregated results from a pile of code analysis tools and presented them in a visually appealing way. I loved the kind of insight it provided.When it listed a bunch of unused methods I went to work pruning them. When it found string concatenation in a big, heavily used loop, I replaced it with StringBuilder. When I moved over to Salesforce, I found a number of solutions but most were either costly or incomplete.
 *Different name, same usefulness.
I did manage to find a wonderful blog post, written by Andrew Fawcett, which covered using the tooling API to call out methods that are not referenced anywhere and display it on a Salesforce canvas. This was exactly what I was looking for, or at least it had the potential to be. You see, finding unused methods is a great help once a code-base becomes large and complex enough. Removing these relics could reduce your code-base and may reduce your unit test and deploy time. That is what makes unused method finding, my top feature to have. Even so, I wanted more, and given the choice to extend his project or make my own, I of course made my own.
I started off with Node.js (bffs 4 lyfe) for no other reason than “I wanted to experiment with it.” Then I reimplemented Andrew’s solution using the node-salesforce module to handle authentication and CRUD operations. Finally, I added a basic plugin system to allow for new checks to be added. How did that all turn out? Let’s find out.
I hate to say it, but Node may have been a mistake here. Don’t get me wrong, I had a lot of fun doing this, but there is a fundamental difference between Java and JavaScript that cranked the complexity right up. His logic was very sequential, going through steps one at a time with the next step depending on the completion of the last. Java did this very well, executing each call out to Salesforce and waiting for a response. Anybody familiar with AJAX should start to squirm right about now. I ended up with a tremendous chain of call backs, which fulfilled its purpose but got real messy in a hurry.
Reimplementing this solution went well enough minus the previously mentioned call back avalanche (call-backalanche?), but it was not without its drawbacks. These are no fault of Andrew and merely reflect the incomplete state of the Tooling API. For one thing, the method reference count does not count references in Visualforce. This was inconvenient, but to anyone coming from a java background where missing references in the view is par for course. I also ran into an issue trying this on an org with a scheduled job. You see, to build up the symbol table, it is compiled by basically performing a “check only” deploy. Salesforce did not like that one of the classes the scheduled job relies on was one of the classes we were checking. This resulted in total failure.
The plugins were perhaps the smoothest part of this project. Node’s ability to require a directory and a bit of trickery resulted in a plugin system as simple as dropping a properly constructed JavaScript file in the directory. These are not as efficient as if they were all part of the main file, as they end up looping over the same data a few times, but it is dead simple to add new checks, change thresholds, and disable old checks.
“So, is this project done?” I can hear you asking. The answer is an unequivocal no. On the roadmap is a web based interface, greater structure for plugins, ability to configure for multiple orgs, and heavy work trying out different flows and Node modules before I set in stone how everything will work. Until then, everything is in tremendous flux. Check it out at my GitHub repo.

